HTML5-Based Graphics are Intuitive, Efficient, and Flexible
For many millennials out there, the thought of HTML might spark a sort of sentimental memory of the peak-days of Myspace. For many, it provided an outlet to express oneself artistically in the digital medium for the first time to show off to everyone in the world via this new thing called, “the internet.” Obviously, HTML is still a mainstay in how internet browsers fundamentally functions–it works in harmony with CSS and Javascript to render content and visual styles of every webpage you have ever visited. It is also invaluable to the live graphics we use when we broadcast any event.
So how is this relevant to broadcasting, and how can it benefit those of us in the broadcast industry? For starters, it is fundamentally a cloud-based service. More and more, workflows in the modern age either prefer or even require remote collaboration and operation, and HTML is the perfect medium for that.
How does HTML Work?
The HTML language provides a set of instructions to predictably render content on any client device that views it, rather than sending massive amounts of data in the form of pre-rendered files or video streams. These instructions allow objects to be drawn in the form of scalable vector-type images and containers, which means they can be infinitely scaled to bring crystal clear images and sharp lines to any broadcast resolution you may want to stream.
For such a long time these coding languages have been and still are so widespread among computers and internet browsers which means they are highly optimized for efficiency and are FAST. Complex and dynamic graphics can be rendered and therefore aired anywhere in the world in what is arguably real-time, often with negligible use of valuable system resources in the production environment. With the close tie to existing coding languages, we can even integrate them to be dynamically updated and rendered by external data sources via simple API connections, just like an app on your phone.
Flowics is an Industry Leader in Providing Professional Quality HTML Graphics
There are a few players in the game when it comes to leveraging HTML-based graphics engines, but far and away the one that leads the pack is Flowics.
Flowics, a tech company founded in Argentina which quickly spread first through Latin America and then globally, first came into our sights at BCC Live after Facebook announced that its own internal HTML graphic platform, Vidpresso, would be no more. At the time, we heavily relied on Vidpresso to integrate live Facebook engagements with graphics on-air, and Flowics served to perfectly fill that deep hole in the market we needed.
Flowics immediately came into its own as an exciting graphics engine for us because it was familiar. The graphical user interface (GUI) of the platform is like a comfortable and familiar layer-based editing software like Adobe Photoshop or Illustrator, with tools that aren’t afraid to hide their true framework that is driven by HTML (Imagine if only we had a specialized Adobe Photoshop for Myspace back in the 2000s!).
Flowics’ Support
However, let’s talk about the real invaluable feature of Flowics–their tech support. This company should be the textbook example of how businesses should operate and help their customers. They have 24/7 support by real humans who have are passionate about their product and are the ones who directly service it in the background. They are accessible straight from the platform itself and I know at any time of day or night I can get help with technical issues, or even just creatively collaborate on how best to get something done. I have even written in things like, “I understand that this feature has X and Y limitation, and I have this work around in place, but it would really help me if you could adjust how Flowics functions to better work for my scenario” and I can’t even count how many times they pushed an update to address my concerns and ideas within a single day. Incredible!
Even through tremendous growth over the 3 years we’ve worked with Flowics, they have remained consistent as a brand, product, and support team. Flowics rightfully was acquired by video broadcast giant, Vizrt Group, putting them in the same family as NewTek, a standard in video broadcast equipment found in studios all over the world. This quickly put HTML rendering as a native source in our TriCaster equipment, simplifying and improving our workflow.
Check out our post about “NDI and our NewTek Ecosystem” here.
Flowics is All About Linking “Flows” to Your Graphics Package
Flowics’ original claim to fame was the best-in-class API integrations with social media platforms. It allows you to collect and produce what they call a ‘flow’ of data including comments from Facebook and YouTube, Tweets, photos from Instagram, usernames, handles, profile photos, and much more. Additionally, Flowics includes the ability to operate a ‘mechanic,’ which notably integrates with Facebook’s native interaction features such as polling and questions where the user can select an option from a multiple-choice list to vote, or answer a free-form question in the comment section. Not only will this mechanic drive the engagement features on the Facebook platform itself, but return the data back into the Flowics system in the form of a flow with which you can drive graphics on the stream itself to show live results.
Another huge tool that allows you to bring data and content into the system is with ‘Data Providers.’ One of which is known as a data connector, which is basically a library that is constantly growing with an ever-evolving set of features which provide infinite possibilities for live input from external sources.
BCC Partners with Flowics Developers to Innovate New API Integrations as Custom Data Connectors
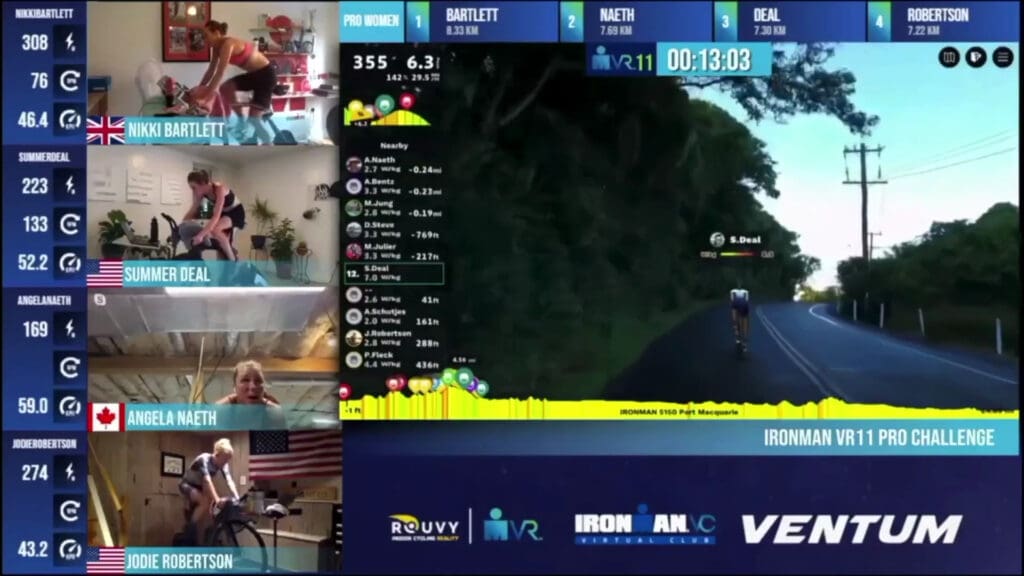
With the COVID shutdown grinding our events, and therefore event broadcasts to a halt, we found ourselves leading the way with producing the IRONMAN Virtual Racing broadcasts on Facebook in 2020. This is when our partnership with Flowics really took off.
We collaborated with Flowics developers in Brazil alongside ROUVY developers based in Czechia to establish a custom API endpoint that integrated with live data from ROUVY that showed, in real-time, the biometric data produced by athletes competing on the ROUVY platform all over the world. This pushed to a JSON data stream that was connected to Flowics that included speed, cycling output power, pedaling cadence, distance, leaderboard, etc. This graphic integration is what made the whole concept of the show possible, and to keep racing alive.
Check out the Flowics Article about our partnership here.
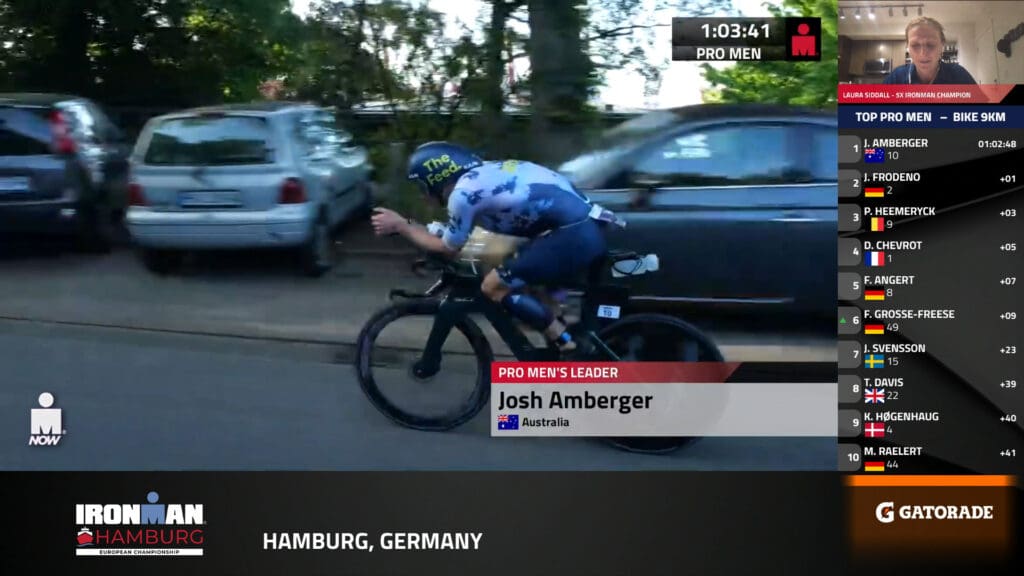
Fast-forward to today when live-racing is back in full-swing. We have applied some of the same foundations with new and improved features of Flowics to create a new custom API endpoint with RTRT, the world-leading endurance sport timing platform host for IRONMAN and Rock ‘n’ Roll Running Series timing data globally. Using this connection, we can drive content and graphic automations in real-time from data streams coming straight from the race timers on-site at the race.
How it Works
The RTRT data connector is a must for us to provide accurate, complex, and real-time results on-air of our broadcasts. Another example of a super powerful data provider we use extensively is the Google Sheets Provider. We use this provider in so many ways, but perhaps it’s most valuable function is organization. Although Flowics allows you to edit text fields on-the-fly within the Rundown Controller, once your production has a certain number of overlays it can be tricky to maintain and update every single one. Especially when the same text should populate multiple elements, such as event titles and logos.
With Google, we can move all our editing and updating to come from a singular, “master” spreadsheet. Plus, you gain access to nearly the full feature set of Google Sheets. For example, we use a publicly available add-on called API Connector, which serves as an endpoint to integrate with Openweather.org to pull weather data from any location in the world. Then using Sheets, we can interpret and format those data in nearly infinite ways to show a clear, accurate, and simple weather graphic on-air.
When using a data provider, you open additional features including “Conditional Visibility” where you can apply logical arguments to automating whether an element is visible or hidden. This provides unlocks a TON of opportunities for creativity. Think:
If ‘place’ equals 1, then show a special avatar next to their name.
When column A in the spreadsheet is empty, then hide that item.
If ‘country’ equals USA, show the USA flag
This can cut down on manual data entry and management immensely and let the graphics engine do the work for you.
Any Device in the World with an Internet Connection Can Become a Destination for the Graphic “Stream”
Simply put, the published output from Flowics is just a webpage. It’s a public URL available to load for anyone on the internet that has the URL, which is uniquely created for each graphic experience you create in Flowics. The graphics are created in the cloud, operated within the cloud, and output from the cloud to a public internet destination. This means no costly internet bandwidth and hardware to encode a video stream out of a studio. The same graphic content can be ingested in an infinite number of systems simultaneously with no effect on the stability of the system.
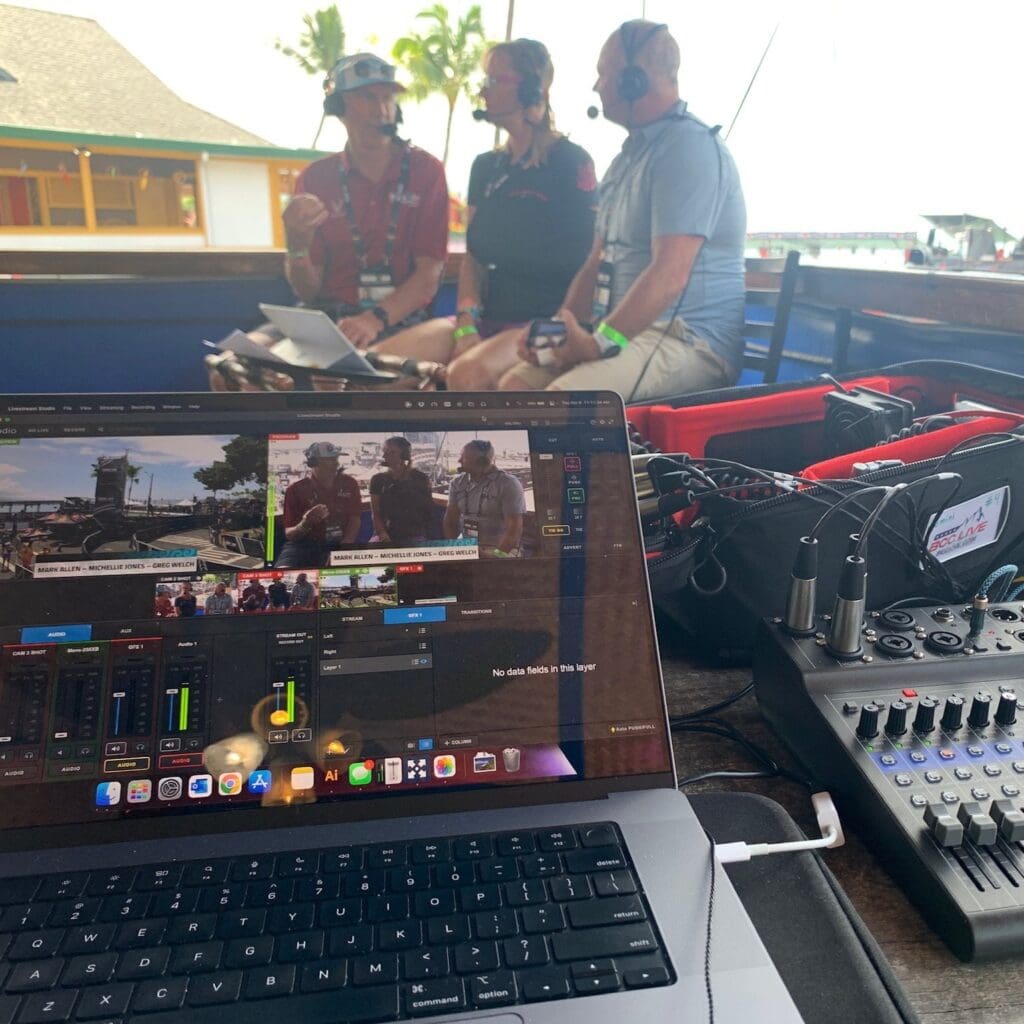
Plenty of broadcast environments can use a web page as a video source. Wirecast, Livestream Studio, OBS, vMix, NewTek (since the September 2022 acquisition by Vizrt Group) are all examples. This means nearly any broadcaster large or small can intuitively add any Flowics output to their production with no additional software, hardware, or significant internet bandwidth.
Other Graphics
We even use Flowics for uses other than on-air graphics. We have found enormous value in running a separate instance of Flowics that is nothing more than a clock countdown which cues on-air talent for commercial breaks. This is ingested as an overlay to the feed that the talent uses to monitor the feed, and the clock is dropped right on top of the feed where they can’t miss it. This same URL can be viewed by remote directors, OTT ad operators, and even additional language broadcasts anywhere in the world which keeps everyone synchronized with when a commercial starts and ends.
Cloud-based broadcasting is here to stay. We’re excited to be at the forefront of cloud-based graphics for high-end broadcasting and can’t wait to see how this product continues to grow and evolve, and pushes BCC Live to grow and evolve alongside it!